
This report provides an overview of the Medical Workforce Race Equality Indicators. The Trust has been proactively collating MWRES data since 2021, resulting in the ability to identify trends. Recent communication from NHS England have detailed that there will be no data collections for the Medical WRES this year.
Report provided for:
- Information
- Assurance
Report to: Trust Board
Date of Meeting: 03.10.2024
Presented by: Rob Cragg, Chief People Officer
Prepared by: Catherine Pollard, Medical Directorate Business Manager
| Link to Quadruple Aim | Joy and pride in work | ||
|---|---|---|---|
| Aligned to Board Assurance Framework Risk | 2.0 Failure to recruit, develop and retain a diverse & talented workforce, due to a national workforce shortage and reputational factors, may impact on the quality of care. | ||
| Executive summary | This report provides an overview of the Medical Workforce Race Equality indicators. The Trust has been proactively collating MWRES data since 2021, resulting in the ability to identify trends. Recent communication from NHS England have detailed that there will be no data collections for the Medical WRES this year. |
||
| Recommendation/ required action | The Board is ask to note the findings and seek further information when required. | ||
Contents
- Introduction and background
- Highlight summary
- MWRES indicators
- National Staff Survey results
- In the last 12 months how many times have you personally experienced harassment, bullying or abuse at work from patients / service users, their relatives or other members of the public?
- Percentage of doctors experiencing harassment, bullying or abuse from staff in the last 12 months
- Staff believing their Trust provides equal opportunities for career progression or promotion
- Staff in the last 12 months having personally experienced discrimination at work from a manager, team leader or other colleague
- References
Introduction and background
The National Medical Workforce Race Equality Standard (MWRES) data set, relating to 2020, was originally published in July 2021. However, up until March 2023 there has been no formal request to collate MWRES data. In March 2023 a non-mandatory request was received from NHS England to submit relevant data, to which the Trust opted to submit a return. Disappointingly though, NHS England have recently communicated that no data collection will be sought for March 2024.
There are 11 indicators in the MWRES:
- Indicators 1 to 4 reflect variation in career progression and pay, differential attainment at various stages of training, and differences in treatment by the regulatory system.
- Indicators 5 to 10 represent medical staff perceptions of how they are treated by colleagues, employing organisations, and patients.
- Indicator 11 highlights the diversity of the councils and boards of medical institutions, such as the medical royal colleges.
Although there is no mandatory requirement from NHS England to submit MWRES data, the Trust has been tracking data against the indicators since 2021, in order to take proactive steps to address any inequalities identified.
The LSCft MWRES data has been sourced from the following places:
• Electronic Staff Records (ESR)
• Medical Human Resources records
• NHS Staff Survey
• Professional standards, appraisals and revalidation records
The LSCft MWRES data only contains data in reference to the medical workforce. The dental workforce has not been included within this iteration.
Highlight summary
The Trust has been proactive in collating MWRES data since 2021, resulting in the ability to identify trends. As with last year, the Trust has been able to disaggregate the B.A.M.E data further, giving more insights and opportunities to identify and address areas of inequality.
Whilst the report provides further detailed analysis and trends, a summary of findings for 2023/24 have been listed below:
- All Medical Grades - as at March 24, 64.4% of the medical workforce are B.A.M.E doctors, and 28.8% are white doctors. The B.A.M.E medical workforce has increased in March 2024 by 2.3% from the previous year.
- Consultant Workforce - as at March 24, 58% of the consultant workforce are B.A.M.E doctors, and 38% are white doctors.
- Medical Leadership - as at March 24, 63% of the Medical Leadership are B.A.M.E Consultants, with 37.5% accounting for White Consultants. 80% of the B.A.M.E Medical Leaders are asian, with 20% being black.
- B.A.M.E consultants - 63% of the consultant B.A.M.E workforce are asian doctors. In 2023/24 16% of the B.A.M.E Consultant workforce were represented by black doctors.
- Consultant Recruitment - In 2023/24 there were 14 substantive consultants recruited, of which five were white, five were asian, one was black and one was other B.A.M.E.
- Complaints - out of all the complaints received for 2023/24, 55% relate to B.A.M.E doctors. International Medical Graduates make up 86% of the B.A.M.E complaints.
- Data also shows that 70% of complaints received in 2023/24 were in relation to International Medical Graduates.
- National Staff Survey - NSS responses have increased 18% upon the 2022/23 response rate.
- NSS harassment, bullying or abuse from staff - for the B.A.M.E medical workforce there has been an increase in the number of occurrences that these behaviours have been experienced from both ‘manager’ and ‘other colleagues’
- NSS Equal opportunities for career progressions or promotion - when B.A.M.E doctors were asked if they believe the Trust provides equal opportunities for career progression and promotion, the positive ‘yes’ response rate has remained high at 86% for the last three years.
- NSS personal experiences of discrimination - for this MWRES indicator the positive responses of ‘no’ have increased over the years from 72% in 2020/21 through to 93% in 2023/24 for the B.A.M.E medical workforce.
MWRES indicators
- Medical Director – This MWRES category aligns to the Chief Medical Officer (CMO) position at LSCft
- Clinical Directors – This MWRES category refers to any medical leader that is a direct report of the CMO; Deputy CMOs, Associate CMO, Network Medical Directors and the Guardian of Safe Working. For the purposes of the MWRES data, this category does not include the Associate Medical Directors.
- Consultants – This category includes all consultants that do not align to the two MWRES categories above.
- Specialty Doctors and Specialist grades (SAS) – A doctor becomes a SAS doctor following a number of years training. A SAS doctor can either remain at this level, or chose to move onto the formal training route, as a Higher Trainee, or complete the Certificate of Eligibility for the Specialist Register (CESR). Both routes lead to a consultant role.
- Locally Employed Doctor (LED) – A LED is a doctor with locally agreed terms and conditions, employed usually on a non-permanent basis. At the Trust, in general there are two types of LED. A Trust grade doctor who has taken time away from the UK formal training route, for personal reasons and is contracted to work at a junior doctor level, supporting gaps within the Trust’s junior doctor workforce (including on-call out of hours rotas), caused by either formal study leave or rotational gaps. The second type of LED is the Medical Training Initiative (MTI) doctor. This is a Government scheme that provides an entry route for overseas doctors wishing to train and develop their skills in the NHS before returning to their own country.
- Doctors in postgraduate training – We have circa 150 postgraduate medical trainees working within our services at any one time. These trainees are employed by the Lead Employer; Mersey and West Lancashire Teaching Hospitals NHS Trust, or the local acute Hospital Trusts, within the Lancashire and South Cumbria Integrated Care System.
Highlights of medical categories
The various stacked bar charts in this section provide details of ethnicity across the different categories and sub-categories of the medical workforce, as requested by NHSE.
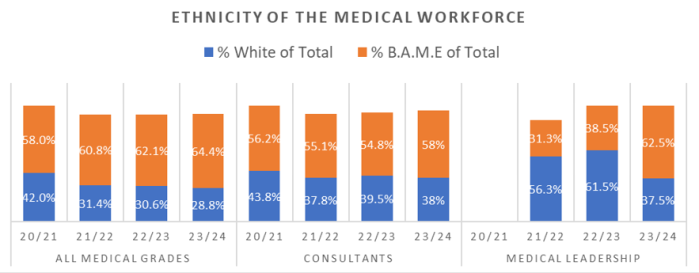
All Medical Grades
- As at March 2024, 64.4% of the medical workforce are B.A.M.E doctors, and 28.8% are White doctors.
- In terms of trends the B.A.M.E medical workforce has increased in March 2024 by 2.3% from the previous year. Whilst the white medical workforce has decreased in March 2023 by 1.7%, from the previous year.
Consultant workforce
- As at March 2024, 58% of the consultant workforce are B.A.M.E doctors, and 38% are White doctors.
Medical Leadership
For the purposes of reporting to NHS England, the MWRES ‘Medical Director’ category aligns to the Chief Medical Officer (CMO) position at LSCft, whilst the MWRES ‘Clinical Director’ category aligns to all senior medics who report directly to the CMO; Deputy CMOs, Network Medical Directors (NMDs), relevant Associate CMOs and the Guardian of Safe Working. The Associate Medical Directors have not been included within the data submission, as they report directly to the NMDs.
- Data as at March 24 show that 62.5% of the Medical Leadership are B.A.M.E Consultants, with 37.5% accounting for White Consultants. These percentages are complete opposite to 2022/23. The B.A.M.E Medical Leadership is representative of the medical workforce.
- 80% of the B.A.M.E Medical Leaders are Asian and 20% are Black.
B.A.M.E Medical Workforce
- The chart below shows the disaggregation of the B.A.M.E workforce, with 63% of the B.A.M.E workforce consisting of Asian doctors
- In terms of Consultants, circa 70% of the consultant B.A.M.E workforce are Asian doctors
- Black doctors represent 22% of the B.A.M.E workforce in 2023/24.
- In 2023/24 16% of the B.A.M.E Consultant workforce were represented by Black doctors.

Consultant Recruitment
In 2023/2024 there were 14 substantive consultants recruited, of which five were White, five were Asian, one was Black and one was Other B.A.M.E. In terms of shortlisting, in one round of recruitment one White and one Asian Consultant were not successfully appointed following shortlisting due to another candidate scoring higher in the interview.
Complaints, referrals and investigations
The table below details the percentage of complaints received in 2023/2024, disaggregated by ethnicity and primary place of qualification. In total the Trust received 40 complaints relating to doctors in 2023/24. Complaints against IMG medics have reduced from 2022/23 from 38, to 28. However, still remain the highest amongst UK and EEA graduates.
| White |
B.A.M.E Total |
Black | Asian | Other | Not Known |
% of Primary Qualification |
|
|---|---|---|---|---|---|---|---|
| UK Medical Graduate | 29% | 5% | 0% | 7% | 0% | 18% | 13% |
| EEA Medical Graduate | 71% | 9% | 0% | 13% | 0% | 0% | 18% |
| International Medical Graduate | 0% | 86% | 100% | 80% | 100% | 82% | 70% |
| Ethnicity % of the total | 18% | 55% | 5% | 38% | 13% | 28% | N/A |
- The data shows that 70% of complaints received are in 2023/24 were in relation to international medical graduates.
- Out of all the complaints received for 2023/24, 55% relate to B.A.M.E doctors. International medical graduates make up 86% of the B.A.M.E complaints.
- Out of all the complaints received for 2023/24, 38% relate to Asian doctors. In terms of the Asian doctors, 80% obtained their primary qualification in International countries (outside of the EEA), 7% within the UK.
- 28% of the total complaints received in 2023/24, their ethnicity is ‘Not known’. However, 82% obtained their primary qualification in international countries, 18% in the UK and 0% in EEA countries.
- 18% of complaints relate to White doctors, with 29% of these obtaining their primary qualification in the UK, 71% within EEA countries and 0% within international countries.
National Staff Survey (NSS) results
As a medical workforce, the NSS responses have increased 18% upon the 2022/223 response rate.
| No. of responses | Increase (+ve) / Decrease (-ve) | |||||
|---|---|---|---|---|---|---|
| NSS Year | White | B.A.M.E | Total | Total response | White | B.A.M.E |
| 2023/24 | 37 | 55 | 92 | 18% | 32% | 10% |
| 2022/23 | 28 | 50 | 78 | 56% | -3% | 138% |
| 2021/22 | 29 | 21 | 50 | 28% | 38% | 17% |
| 2020/21 | 21 | 18 | 39 | N/A | N/A | N/A |
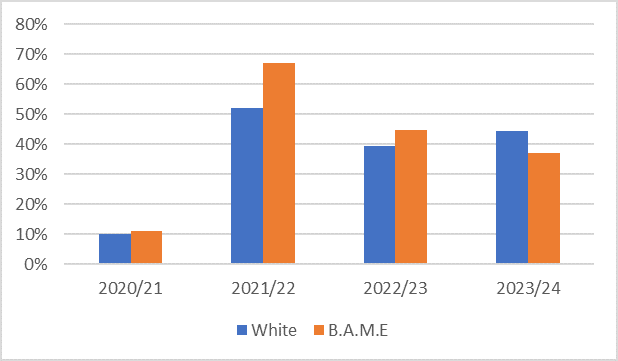
In the last 12 months how many times have you personally experienced harassment, bullying or abuse at work from patients / service users, their relatives or other members of the public?
In terms of B.A.M.E medics there has been a reduction in the percentage of those who have personally experienced harassment, bullying or abuse from patients, their family or members of the public.
There has been a distinctive increase from 39.3% to 44.4% of white medics experiencing harassment, bullying or abuse from patients, their family or members of the public.
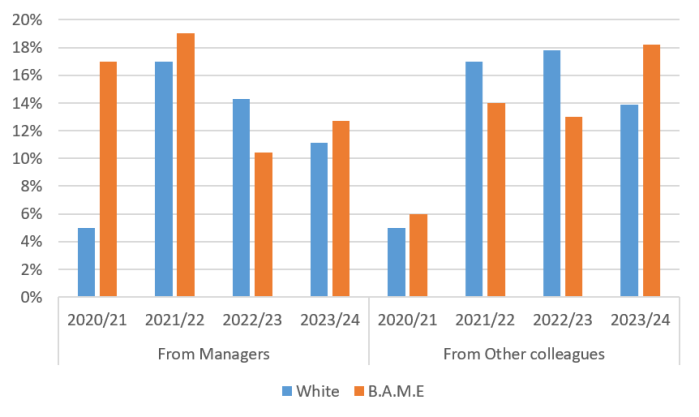
Percentage of doctors experiencing harassment, bullying or abuse from staff in the last 12 months
For this indicator we have taken both the ‘From Managers’ and ‘From Other Colleagues’ categories within the NSS and referred to these as ‘Staff’, for the purposes of the MWRES data.
The chart below indicates that for the B.A.M.E medical workforce there has been an increase in the number of occurrences that these behaviours have been experienced from both ‘Manager’ and ‘Other Colleagues’.
For the White medical workforce there have been a reduction in the number of times these behaviours have been experienced from ‘Managers’, but there has been an increased number of occurrences of the behaviour from ‘Other Colleagues’
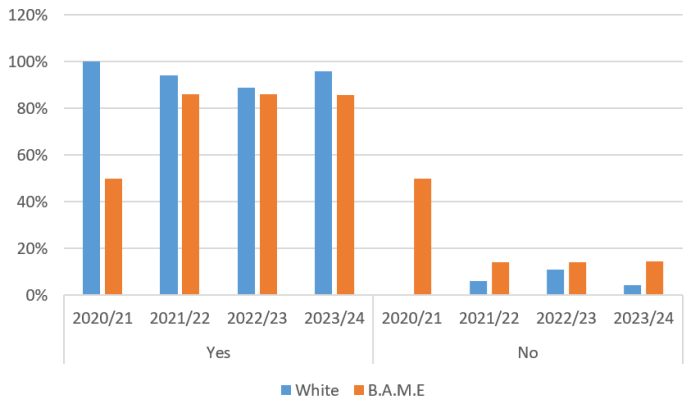
Staff believing their Trust provides equal opportunities for career progression or promotion
The table below shows two distinct trends for both the positive response of ‘Yes’ and the negative response of ‘No’.
When B.A.M.E doctors were asked if they believe the Trust provides equal opportunities for career progression and promotion, the positive ‘Yes’ response rate has remained high at 86% for the last 3 years.
When White doctors were asked if they believe the Trust provides equal opportunities for career progression and promotion, there had been a steady decrease up to and including 2022/23 to 89%. However, NSS results for 2023/24 show an increase to 96%.
Any ‘Don’t know’ responses have been removed. Therefore, the percentage results are based on only the total of the ‘Yes’ and ‘No’ responses.
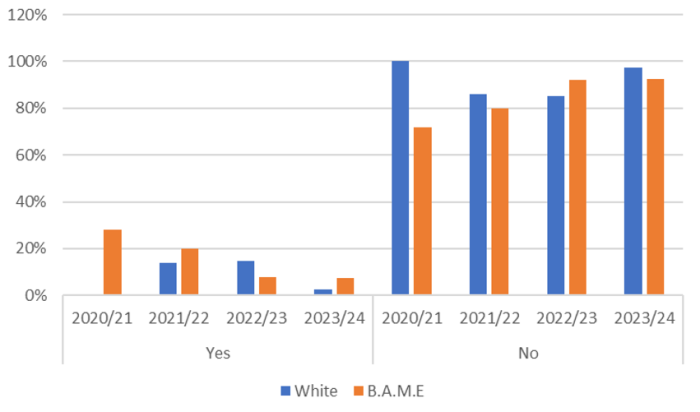
Staff in the last 12 months having personally experienced discrimination at work from a manager, team leader or other colleague
For this MWRES indicator, the positive responses of ‘No’ have increased over the years from 72% in 2020/21 through to 93% in 2023/24 for the B.A.M.E medical workforce
For White medics the positive response of ‘No’ has increased from 85% in 2022/23 to 97% in 2023/24.
References
The Board is asked to note the findings and seek further information where required.